Thermal & Air Quality Comfort Dashboard

UX/UI | Product Design

Thermal & Air Quality Comfort Dashboard Cover
Thermal & Air Quality Comfort Dashboard - Project Overview

International Airport

Bert Platform Solution® Deployed in International airports for Thermal & air quality Comfort. The areas are catered by VAVs (Variable Air Valves) and AHUs (Air Handling Units).
(Due to NDA restrictions, details are limited)

My role:
UX/UI | Product Designer
Tools used:
Adobe XD, Figma, Illustrator, Photoshop, After effects
What I did ?
User Research, Information Architecture, Usability Study, Design Language

The problem:

How might we ensure optimal thermal and air quality comfort in the airport?

The Industry

Modern airport operations are increasingly complex, with thermal comfort and air quality being critical for passenger satisfaction and staff productivity. Despite advanced HVAC systems, many airports still lack intelligent control solutions that optimize comfort while minimizing energy consumption.

The Background

Airports are high-traffic environments where passenger comfort is crucial. Maintaining optimal thermal conditions and air quality is a constant challenge, especially with varying occupancy, flight schedules, and diverse passenger needs. Can airport operators ensure consistent comfort for all passengers and staff while optimizing energy use across complex HVAC systems?

The Challenge:

We set out to understand the challenges in maintaining consistent thermal comfort and air quality for passengers and airport staff, despite fluctuating occupancy, diverse environmental conditions, and the complexity of HVAC operations.

Our previous project with an international airport :

  • Implemented an AI + IoT-enabled comfort optimisation solution across multiple airport zones.

  • Integrated Variable Air Valves (VAVs) and Air Handling Units (AHUs) into a unified, intelligent control ecosystem.

  • Enhanced thermal comfort consistency and indoor air quality through real-time adaptive control.

  • Enabled data-driven insights by linking occupancy patterns, flight schedules, and environmental conditions.

  • Achieved measurable energy savings while maintaining optimal comfort for passengers and staff.

  • Established a scalable model that became the foundation for subsequent international airport deployments.

Discover

User Research

understand the challenges

To understand the challenges of maintaining thermal comfort and air quality in a new large-scale international airport, Our team conducted discussions with key stakeholders:

  • Head of Airport Operations: Shared insights on operational challenges, including the constant monitoring required across multiple zones and the difficulty of maintaining consistent thermal comfort. They highlighted the importance of balancing passenger comfort with energy efficiency and expressed the need for comprehensive reporting and historical analysis.
  • Chief Digital Officer: Provided perspectives on strategic objectives, including integration with existing digital systems, and the ability to adjust set points, receive notifications, and review past recommendations for informed decision-making.
  • BMS Operators: Walked us through the current manual workflows, demonstrating the BMS screens and control panels. They showed how HVAC set points are adjusted based on approximated Predicted Mean Vote (PMV) readings and highlighted pain points such as:
    • Dependence on human observation and approximation
    • Difficulty tracking real-time comfort levels across zones
    • Lack of automated optimisation, leading to inconsistent thermal comfort
    Through these discussions, we gathered a clear understanding of the current system, existing workflows, and pain points, which helped identify opportunities for automation, smarter monitoring, and improved thermal comfort across the airport.

Current System & BMS Operations

The Stakeholders

The airport's existing thermal control system relied heavily on manual monitoring and adjustments. We reviewed the current BMS operations and gathered insights on how HVAC set points were managed across different zones. The system required operators to constantly observe temperature and PMV readings and make changes based on human approximation. Through our review, we understood:

  • The BMS provided real-time data but lacked automated optimisation for thermal comfort.
  • Operators manually adjusted set points, which was time-consuming and prone to inconsistencies.
  • Comfort levels frequently fluctuated outside the desired PMV range due to the reactive nature of the system.
  • Historical data and reporting were limited, making it difficult for the operations team to analyse performance or track energy savings over time.
Thermal & Air Quality Comfort Dashboard - Project Overview

Proposed Solution by Bert Labs

To address the challenges of manual thermal control and inconsistent comfort levels, we proposed a smart, automated solution leveraging Bert Labs expertise in predictive thermal comfort and energy optimisation. The solution includes:

  1. Automated PMV-Based Control:
    • The system continuously monitors key environmental parameters (temperature, humidity, airflow, occupancy) across all zones.
    • Using Predicted Mean Vote (PMV) models, it calculates optimal comfort levels in real time.
    • Bert Labs provided fixed temperature set points for each zone to ensure consistent comfort and optimal system performance, aligning with the project's operational and efficiency requirements.
  2. Machine Learning & Predictive Models:
    • Historical BMS data and real-time sensor inputs are used to train machine learning models that predictzone-specific thermal conditions.
    • The models continuously refine recommendations, learning from past adjustments, occupancy patterns, and external weather conditions.
    • Operators can review predicted & optimised values and override the system if needed, ensuring flexibility and control.
  3. Smart Reporting & Insights:
    • The system generates comprehensive reports for facility managers and decision-makers, highlighting energy consumption, comfort levels, and system performance.
    • Real-time notifications and alarms alert operators to deviations from optimal comfort ranges.
    • Historical recommendations and performance trends help optimise operations over time.
  4. Role-Based Control & Flexibility:
    • Different stakeholders (Operations, BMS Operators, CDO) have role-based access to dashboards, controls, and reports.

By integrating Bert Labs PMV-based models with the airport's BMS, the system enables automated, data-driven thermal control, reduces manual interventions, maintains consistent comfort across zones, and provides actionable insights to optimise energy usage.

Define

Meet Seon

Seon is 42 years old and serves as the Head of Airport Operations at the international airport in Singapore. He oversees terminal operations, ensuring a balance between passenger comfort, system performance, and energy efficiency.

Needs & Goals

Seon wants to monitor real-time and historical comfort data across terminals. He needs comparisons between actual and recommended PMV values to assess performance. He wants access to smart reports and energy-saving summaries to review with his management team. He aims to ensure thermal comfort and sustainability targets are consistently met.

Behaviors

Seon regularly reviews reports and dashboards to evaluate operational efficiency. He discusses system performance insights with digital and BMS teams. He values data visualisation and trend analysis over raw data tables.

Meet Desmond Tan

Desmond is 35 years old and works as a Building Management System (BMS) Operator at the international airport. He monitors the HVAC systems across multiple zones to maintain passenger comfort and ensure smooth day-to-day operations.

Needs & Goals

Desmond wants to easily observe real-time PMV values across airport zones. He needs clear indicators showing whether each area is within or outside the comfort range. He looks for automated suggestions or alerts when the PMV starts to drift, so he can act quickly. He wants the system to reduce manual set point adjustments and save time.

Behaviors

Desmond job frequently switches between BMS screens to check values and make manual changes. He relies on experience and approximation when deciding which set points to modify. He prefers simple, visual interfaces that clearly highlight comfort deviations. He cross checks comfort data with HVAC performance metrics to ensure system stability.

In order to understand what pages or functionality will be needed for Praneeth and Seun to accomplish his goal, I mapped out the User flows.

We had already designed a sitemap structure for the Bert Platform Solution projects, which had its own framework, so I needed to find a balance with the airport's existing dashboard design.

While our initial recommendation included fixed temperature set points for each zone to maintain consistent comfort and system efficiency, the client requested a range-based configuration with lower and upper set points to suit their operational requirements.

User seon

User Flow: Seon monitors comfort & PMV data

User Flow: Seon monitors comfort & PMV data
User desmond

Desmond monitors HVAC MVP compliance

Desmond monitors HVAC MVP compliance

Structuring the content: Sitemap

In order to ensure a clear structure of the app, I've created a sitemap, based on the user flows.

Sitemap

Sitemap After open card sort

Develop

Wireframing:
Sketches & first clickable prototype.

Thermal Air Quality Project - Wireframe 1
Thermal Air Quality Wireframe 1 Design
Thermal Air Quality Project - Wireframe 2
Thermal Air Quality Wireframe 2 Design
Thermal Air Quality Project - Wireframe 3
Thermal Air Quality Wireframe 3 Design

I turned the sketches to a clickable prototype. This allowed me to quickly test my solution and iterate on it.

Learnings from Usability Test:
Problems and solutions.

The Airport Dashboard prototype was tested with 3 users, including 2 members from the BMS operations and 1 airport facility management teams.
The findings from the usability Test sessions were documented and rated by severity.

The most severe problems were:

  • Low emphasis on PMV values, making it difficult for operators to monitor comfort levels quickly.
  • Lack of role-based access clarity, as the BMS team requested new permission levels and role hierarchies.
  • Limited visual hierarchy between system alerts and normal parameters, causing slower responses during active faults.
  • Overloaded data presentation in some dashboard sections, reducing readability and comparison across zones.

These issues were addressed in the next high-fidelity iteration of the Airport Dashboard.
I refined the visual hierarchy, gave stronger emphasis to comfort metrics (PMV, temperature, humidity), improved role-based access flows, and standardised icons and alert colours for consistency across the platform.

Deciding on the Look & Feel of International Airport

Airport Design System

Deliver

Thermal Air Quality Dashboard - Trend Overview
Thermal Air Quality Dashboard Trend Overview Screen
Trend Overview
“Track overall Thermal & Air Quality comfort at a glance”
Home Page
“Monitor total energy savings”
Thermal Air Quality Dashboard - Home Page
Thermal Air Quality Dashboard Home Page Screen
Thermal Air Quality Dashboard - Trend Overview
Thermal Air Quality Dashboard Trend Overview Screen
Thermal comfort insights
“Review comfort history, analysis performance”
Zone
“Ensure optimal comfort for each Zone”
Thermal Air Quality Dashboard - Home Page
Thermal Air Quality Dashboard Home Page Screen
Thermal Air Quality Dashboard - Trend Overview
Thermal Air Quality Dashboard Trend Overview Screen
Add New Roles
“Edit roles, assign new permissions, and maintain consistent access control”

Learnings & Challenges

What I've Learned from the Thermal & Air Quality Comfort Project

Working on the Airport Dashboard project gave me the opportunity to design for a highly technical and operational environment where precision, data clarity, and usability directly impact real-world performance. Collaborating with the BMS team, airport operations, and digital officers helped me bridge the gap between engineering logic and user-centered design.

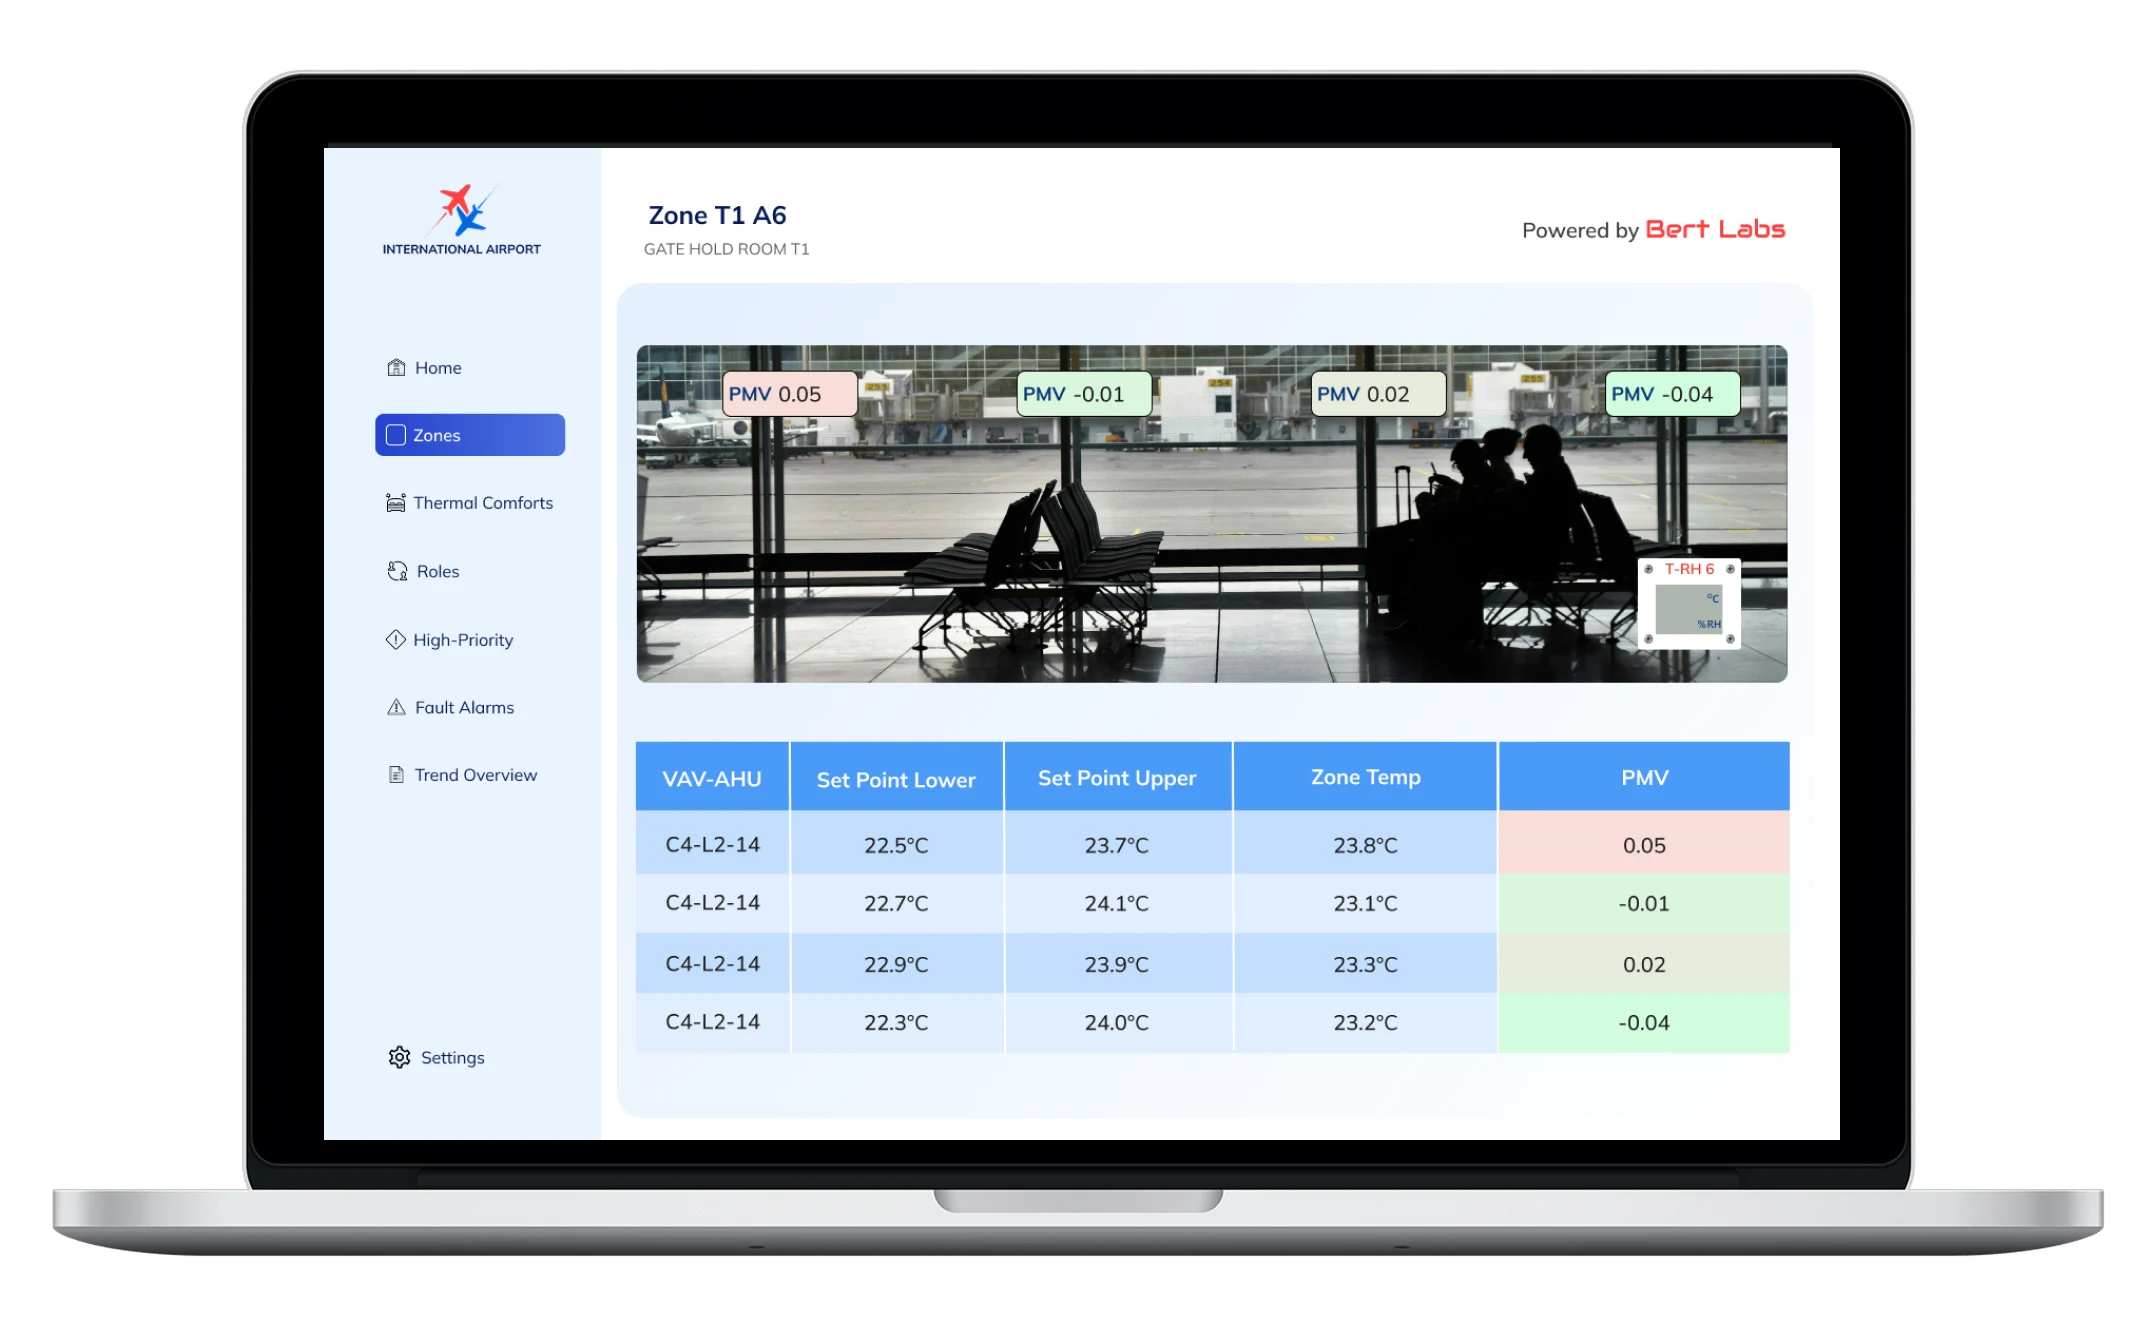
Despite the complexity of the system, I was able to translate dense HVAC data into intuitive, visual interfaces that support quick decision-making. This project taught me the importance of designing for clarity, not just aesthetics.

I've gathered key learnings across the process:

  • In stakeholder discussions, listen for operational patterns, not just pain points, many needs emerge indirectly from how users describe their routines.
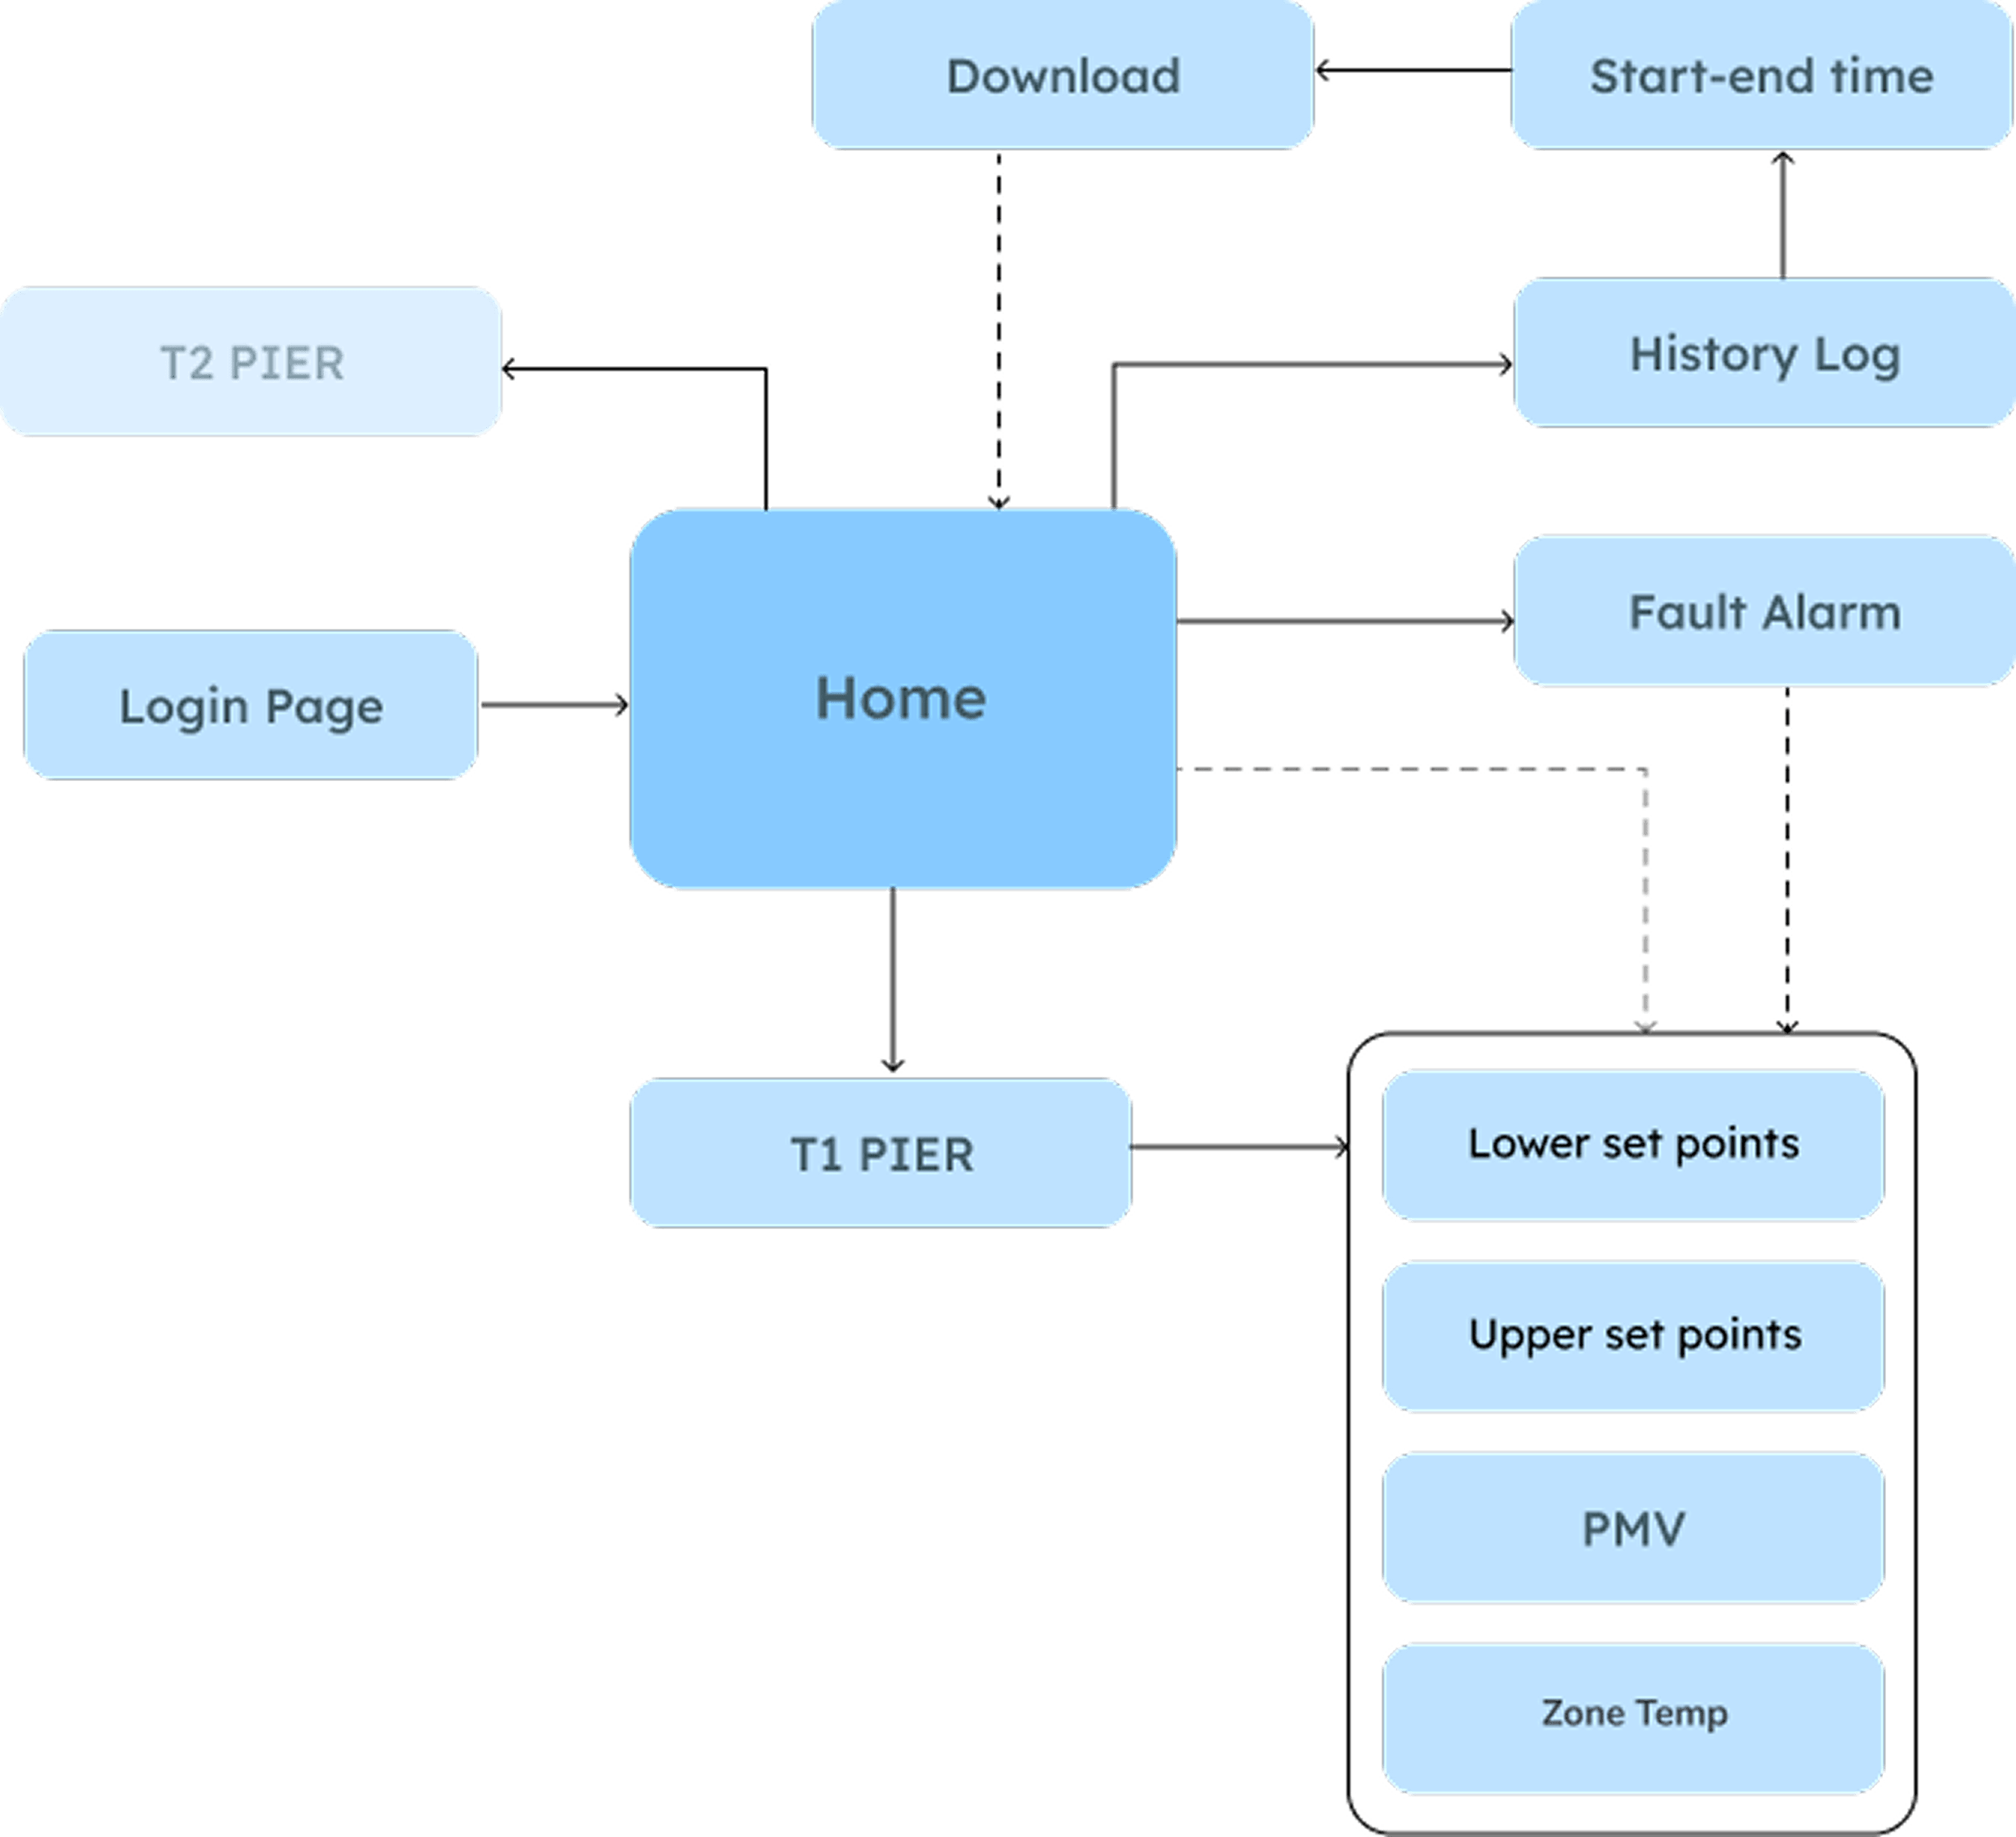
  • Complex systems require layered simplicity. Visual hierarchy and clear grouping of information help reduce cognitive loads.
  • Testing early with BMS operators revealed usability gaps that weren't obvious in wireframes especially around hierarchy and role access.

Moving into the high-fidelity stage, I realised how much impact small details can have on usability and operator confidence. Building this prototype also strengthened my understanding of how AI-driven systems and human decision-making can coexist through thoughtful interface design.

During my time at Bert Labs, I also had the opportunity to work on multiple projects across diverse industries such aspharmaceuticals, chemical plants, pulp and paper manufacturing, office complexes, and retail malls. Each project presented unique challenges in automation, energy optimisation, and comfort control allowing me to deepen my understanding of how contextual factors like industry workflows, building types, and user roles influence system design and interaction patterns.

See International Airport Live

International Airport Live Preview
Download CVDownload CV